subscribe via RSS
Trying GitHub
I’m trying to get GitHub to serve my pages. This is a test and I’m past the Balmer peak.
What is the likelihood I'll be on the Bay Bridge during an earthquake?
The earthquake early Sunday morning woke me and most of the Bay Area up wondering if a this was the Big One geologist have been warning about. This quake on the West Napa fault was only 6.1 according to the USGS but that is not the only fault in the area. The big worry is the Hayward fault that runs behind my house, through the UC Berkeley Memorial Stadium, past Oakland, and goes down to Fremont. This fault is pent up, overdue, and UC Davis geologist John Rundle gives 1:5 odds that it will release a 7.0 quake within the next few years. This is one reason that the Bay Bridge was replaced in 2013, the old structure was crippled in the 1989 quake and was unlikely to survive another serious shake.
The new eastern span of the Bay Bridge is very pretty, cost $6.4 Billion, and has been plagued with safety concerns that I’m not qualified to judge. However, I do cross it to get to work and every so often worry about being on it during a quake. In order to answer the question of what are the chances I’ll be on it during a quake, I looked at my GPS logs that I’ve collected with the Antimap iPhone app. This collects time points at a rate of 30 per second and was designed for sports use but I keep it running whenever I’m traveling. Since early 2014 I’ve been a postdoc at UCSF and have a log of every crossing.
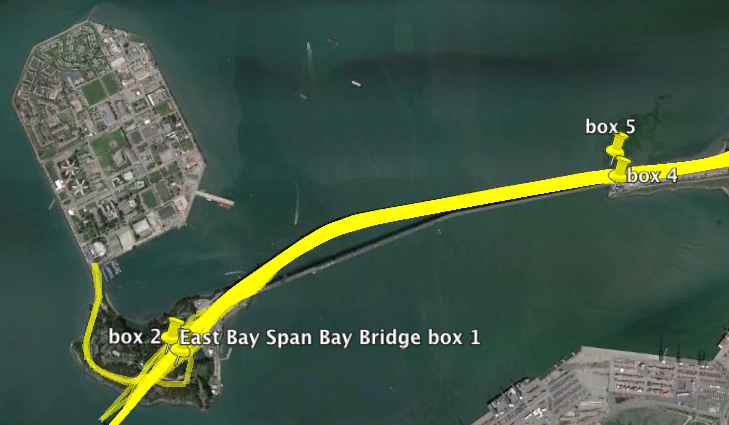
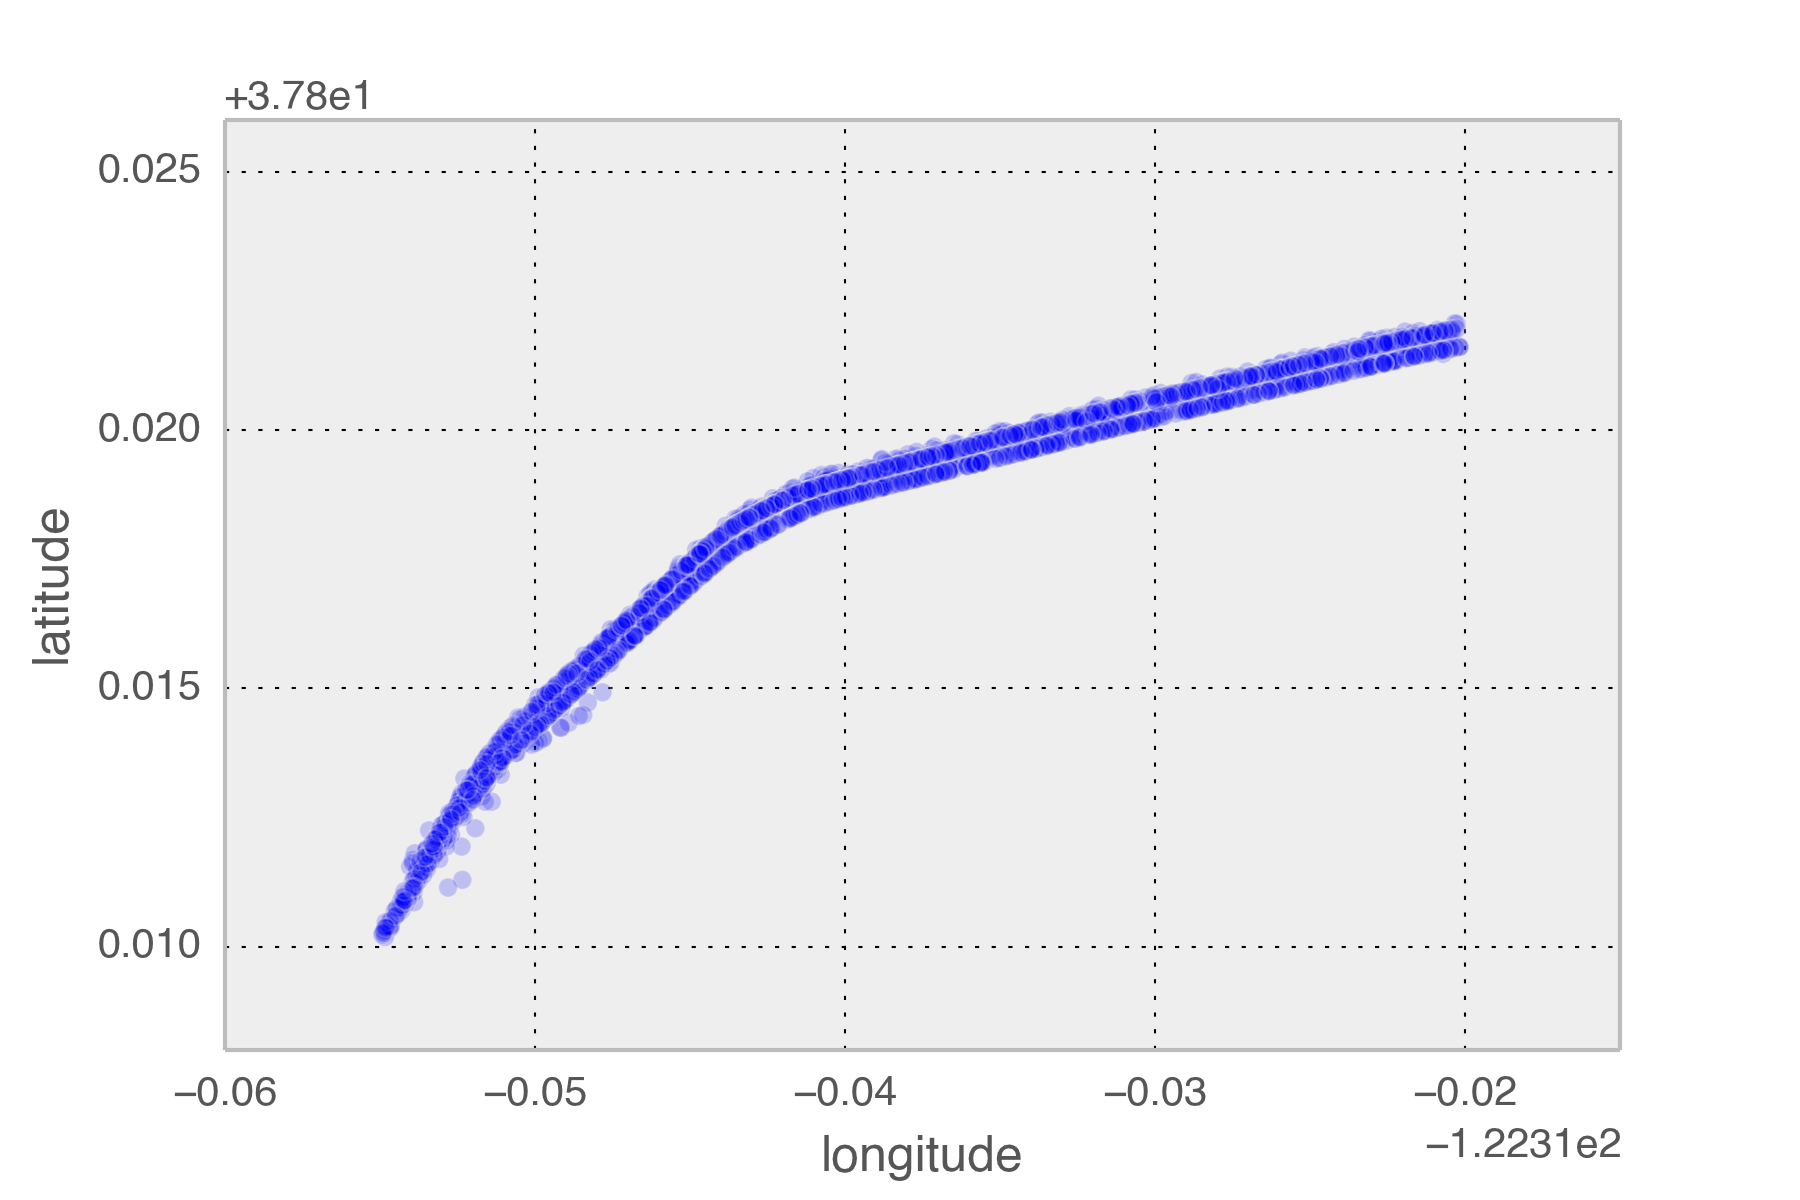
Using the gpxpy python module I extracted all tracks from January to now that passed those the points on the map. These correspond to the exit of the Treasure Island tunnel and the point that the Bay Bridge leaves the ground.
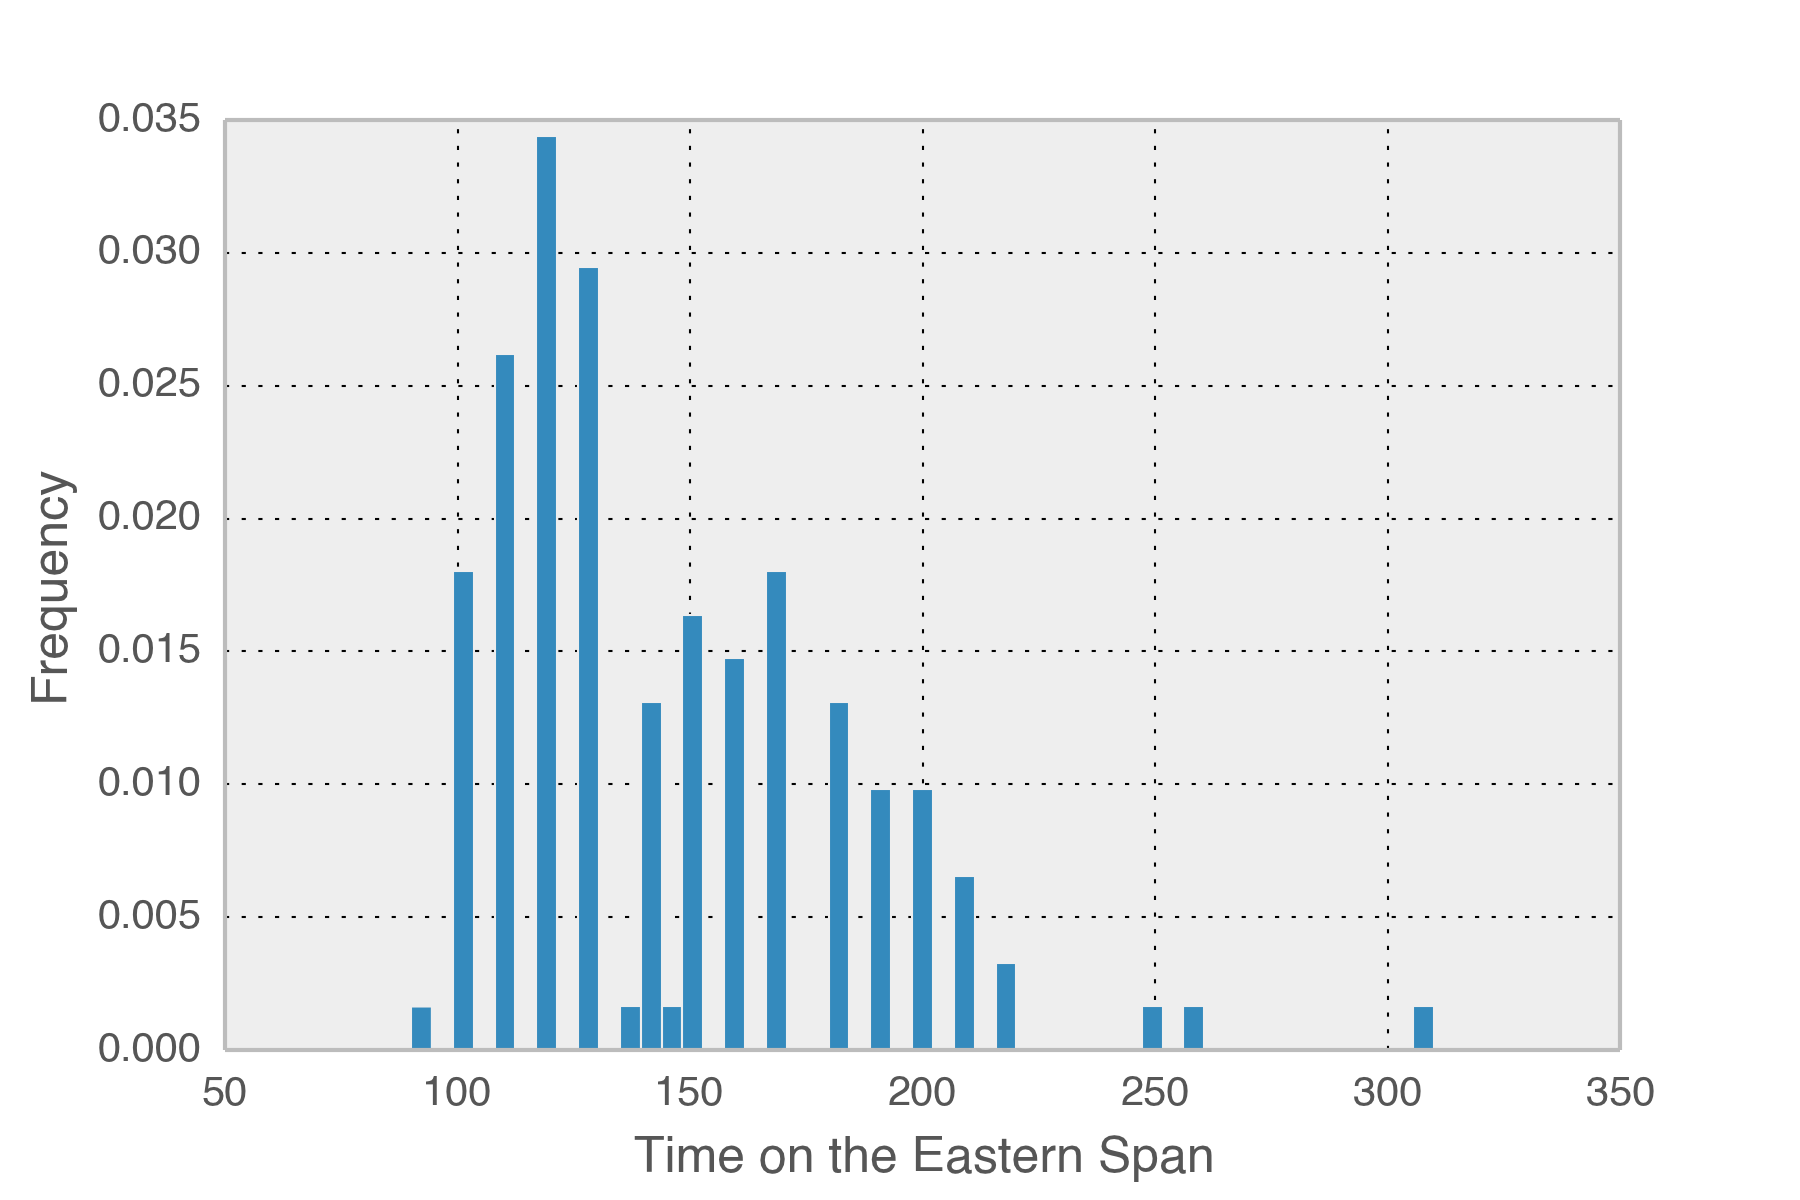
So how long is each trip across the new bridge? The mean time spent is 146 seconds, just over two minutes each way. In total, I’ve spent 5.53 hours crossing that part of the bridge this year. The logs span 5352 hours so I spend around 1/1000th of my time there. There is a 99.896% chance that I will NOT be on the eastern span at any given time. Obviously the solution is to go faster across the bridge.
[
Getting sequencing metadata from NCBI SRA
The GEO page http://www.ncbi.nlm.nih.gov/geo/query/acc.cgi?acc=GSE52386 has a link to the SRA study ftp page which you can use to get all the sequencing reads with wget:
wget -r ftp://ftp-trace.ncbi.nlm.nih.gov/sra/sra-instant/reads/ByStudy/sra/SRP/SRP033/SRP033009/
After that, the fast-dump utility from the sra-toolkit can be used to convert the files to gripped fastq files, ready to be mapped with Bowtie, BWA, or other mappers. However, the file names are uninformative! Is SRR1029869.fastq.gz a sample of the brain or liver? Is this embryonic or postnatal?
To get the metadata for a study we can use the R package SRAdb and a bit of simple SQL.
Set up by installing SRAdb with Bioconductor and downloading the SRA metainfo database. This is a large file > 7 GB so keep this in mind for download times and space on your computer.
source("http://bioconductor.org/biocLite.R")
biocLite("SRAdb")
library(SRAdb)
sqlfile <- getSRAdbFile()
sra_con <- dbConnect(SQLite(),sqlfile)
We can get information about each run by looking in the run table:
run <- dbGetQuery(sra_con, "select * from run where run_accession = 'SRR1029856'")
| RUN_ID | BAMFILE | RUN_ALIAS | RUN_ACCESSION | BROKER_NAME | INSTRUMENT_NAME | RUN_DATE | RUN_FILE | RUN_CENTER | TOTAL_DATA_BLOCKS | EXPERIMENT_ACCESSION | EXPERIMENT_NAME | SRA_LINK | RUN_URL_LINK | XREF_LINK | RUN_ENTREZ_LINK | DDBJ_LINK | ENA_LINK | RUN_ATTRIBUTE | SUBMISSION_ACCESSION | SRADB_UPDATED |
|---|---|---|---|---|---|---|---|---|---|---|---|---|---|---|---|---|---|---|---|---|
| 611310 | NA | GSM1264352_r1 | SRR1029856 | NA | NA | 11/14/13 0:00 | NA | GEO | NA | SRX377662 | GSM1264352 | NA | NA | NA | NA | NA | NA | NA | SRA111212 | 6/10/14 12:20 |
This doesn’t tell us very much but it does contain the crucial field that lets us know what experiment it came from: SRX377662.
Using this information, we can look in the experiment table with:
exp <- dbGetQuery(sra_con, "select * from experiment where experiment_accession = 'SRX377662'")
| EXPERIMENT_ID | BAMFILE | FASTQFTP | EXPERIMENT_ALIAS | EXPERIMENT_ACCESSION | BROKER_NAME | CENTER_NAME | TITLE | STUDY_NAME | STUDY_ACCESSION | DESIGN_DESCRIPTION | SAMPLE_NAME | SAMPLE_ACCESSION | SAMPLE_MEMBER | LIBRARY_NAME | LIBRARY_STRATEGY | LIBRARY_SOURCE | LIBRARY_SELECTION | LIBRARY_LAYOUT | TARGETED_LOCI | LIBRARY_CONSTRUCTION_PROTOCOL | SPOT_LENGTH | ADAPTER_SPEC | READ_SPEC | PLATFORM | INSTRUMENT_MODEL | PLATFORM_PARAMETERS | SEQUENCE_SPACE | BASE_CALLER | QUALITY_SCORER | NUMBER_OF_LEVELS | MULTIPLIER | QTYPE | SRA_LINK | EXPERIMENT_URL_LINK | XREF_LINK | EXPERIMENT_ENTREZ_LINK | DDBJ_LINK | ENA_LINK | EXPERIMENT_ATTRIBUTE | SUBMISSION_ACCESSION | SRADB_UPDATED |
|---|---|---|---|---|---|---|---|---|---|---|---|---|---|---|---|---|---|---|---|---|---|---|---|---|---|---|---|---|---|---|---|---|---|---|---|---|---|---|---|---|---|
| 430097 | NA | NA | GSM1264352 | SRX377662 | NA | GEO | GSM1264352: Forebrain E11.5 H3K27ac Rep1; Mus musculus; ChIP-Seq | GSE52386 | SRP033009 | NA | NA | SRS502469 | NA | NA | ChIP-Seq | GENOMIC | ChIP | SINGLE - | NA | Tissues were cross-linked, lysed, and sonicated and immunoprecipation was performed using H3K27ac (Abcam Ab4729). Input samples represent sonicated DNA before immunoprecipitation Libraries were constructed using standard protocols and the Illumina TruSeq kit with index barcodes. | NA | NA | NA | ILLUMINA | Illumina HiSeq 2000 | INSTRUMENT_MODEL: Illumina HiSeq 2000 | NA | NA | NA | NA | NA | NA | NA | GEO Sample GSM1264352: http://www.ncbi.nlm.nih.gov/geo/query/acc.cgi?acc=GSM1264352 | gds: 301264352 | NA | NA | NA | GEO Accession: GSM1264352 | SRA111212 | 6/8/14 22:14 |
This has the title info which we need to make sense of the data: what tissue and when it was collected.
Now we can use the power of SQL and get all the data at once by joining the run and experiment tables and only getting the rows that match the study ID.
runs <- dbGetQuery(sra_con, "select run_accession, title from run JOIN experiment USING (experiment_accession) where experiment.study_accession = 'SRP033009'")
| RUN_ACCESSION | TITLE |
|---|---|
| SRR1029856 | GSM1264352: Forebrain E11.5 H3K27ac Rep1; Mus musculus; ChIP-Seq |
| SRR1029857 | GSM1264353: Forebrain E11.5 input Rep1; Mus musculus; ChIP-Seq |
| SRR1029858 | GSM1264354: Forebrain E11.5 H3K27ac Rep2; Mus musculus; ChIP-Seq |
| SRR1029859 | GSM1264355: Forebrain E11.5 input Rep2; Mus musculus; ChIP-Seq |
| SRR1029860 | GSM1264356: Forebrain E14.5 H3K27ac; Mus musculus; ChIP-Seq |
| SRR1029861 | GSM1264357: Forebrain E14.5 input; Mus musculus; ChIP-Seq |
| SRR1029862 | GSM1264358: Forebrain E17.5 H3K27ac; Mus musculus; ChIP-Seq |
| SRR1029863 | GSM1264359: Forebrain E17.5 input; Mus musculus; ChIP-Seq |
| SRR1029864 | GSM1264360: Forebrain P0 H3K27ac; Mus musculus; ChIP-Seq |
| SRR1029865 | GSM1264361: Forebrain P0 input; Mus musculus; ChIP-Seq |
| SRR1029866 | GSM1264362: Forebrain P7 H3K27ac; Mus musculus; ChIP-Seq |
| SRR1029867 | GSM1264363: Forebrain P7 input; Mus musculus; ChIP-Seq |
| SRR1029868 | GSM1264364: Forebrain P21 H3K27ac; Mus musculus; ChIP-Seq |
| SRR1029869 | GSM1264365: Forebrain P21 input; Mus musculus; ChIP-Seq |
| SRR1029870 | GSM1264366: Forebrain P56 H3K27ac Rep1; Mus musculus; ChIP-Seq |
| SRR1029871 | GSM1264367: Forebrain P56 input Rep1; Mus musculus; ChIP-Seq |
| SRR1029872 | GSM1264368: Forebrain P56 H3K27ac Rep2; Mus musculus; ChIP-Seq |
| SRR1029873 | GSM1264369: Forebrain P56 input Rep2; Mus musculus; ChIP-Seq |
| SRR1029874 | GSM1264370: Heart E11.5 H3K27ac Rep1; Mus musculus; ChIP-Seq |
| SRR1029875 | GSM1264371: Heart E11.5 input Rep1; Mus musculus; ChIP-Seq |
| SRR1029876 | GSM1264372: Heart E11.5 H3K27ac Rep2; Mus musculus; ChIP-Seq |
| SRR1029877 | GSM1264373: Heart E11.5 input Rep2; Mus musculus; ChIP-Seq |
| SRR1029878 | GSM1264374: Heart E14.5 H3K27ac; Mus musculus; ChIP-Seq |
| SRR1029879 | GSM1264375: Heart E14.5 input; Mus musculus; ChIP-Seq |
| SRR1029880 | GSM1264376: Heart E17.5 H3K27ac; Mus musculus; ChIP-Seq |
| SRR1029881 | GSM1264377: Heart E17.5 input; Mus musculus; ChIP-Seq |
| SRR1029882 | GSM1264378: Heart P0 H3K27ac; Mus musculus; ChIP-Seq |
| SRR1029883 | GSM1264379: Heart P0 input; Mus musculus; ChIP-Seq |
| SRR1029884 | GSM1264380: Heart P7 H3K27ac; Mus musculus; ChIP-Seq |
| SRR1029885 | GSM1264381: Heart P7 input; Mus musculus; ChIP-Seq |
| SRR1029886 | GSM1264382: Heart P21 H3K27ac; Mus musculus; ChIP-Seq |
| SRR1029887 | GSM1264383: Heart P21 input; Mus musculus; ChIP-Seq |
| SRR1029888 | GSM1264384: Heart P56 H3K27ac; Mus musculus; ChIP-Seq |
| SRR1029889 | GSM1264385: Heart P56 input; Mus musculus; ChIP-Seq |
| SRR1029890 | GSM1264386: Liver E11.5 H3K27ac; Mus musculus; ChIP-Seq |
| SRR1029891 | GSM1264387: Liver E11.5 input; Mus musculus; ChIP-Seq |
| SRR1029892 | GSM1264388: Liver E14.5 H3K27ac; Mus musculus; ChIP-Seq |
| SRR1029893 | GSM1264389: Liver E14.5 input; Mus musculus; ChIP-Seq |
| SRR1029894 | GSM1264390: Liver E17.5 H3K27ac; Mus musculus; ChIP-Seq |
| SRR1029895 | GSM1264391: Liver E17.5 input; Mus musculus; ChIP-Seq |
| SRR1029896 | GSM1264392: Liver P0 H3K27ac; Mus musculus; ChIP-Seq |
| SRR1029897 | GSM1264393: Liver P0 input; Mus musculus; ChIP-Seq |
| SRR1029898 | GSM1264394: Liver P7 H3K27ac; Mus musculus; ChIP-Seq |
| SRR1029899 | GSM1264395: Liver P7 input; Mus musculus; ChIP-Seq |
| SRR1029900 | GSM1264396: Liver P21 H3K27ac; Mus musculus; ChIP-Seq |
| SRR1029901 | GSM1264397: Liver P21 input; Mus musculus; ChIP-Seq |
| SRR1029902 | GSM1264398: Liver P56 H3K27ac; Mus musculus; ChIP-Seq |
| SRR1029903 | GSM1264399: Liver P56 input; Mus musculus; ChIP-Seq |
Who spit in the ChIP-seq?
A while back in my previous lab, my officemate performed a ChIP experiment using fruit fly embryos. He was disappointed and surprised to see very little signal and started searching for where the experiment went wrong. There were 95 million reads from the sequencer but when he looked at the reads that matched melanogaster, there were only 4 million! My friend took a handful of the contaminate reads and searched with BLAST to find that a good chunk came from a human genome. Somewhere along the line, a whole bunch of human DNA got into his experiment. Being a careful scientist he wanted to know if he made a mistake and contaminated his data so he gave me the reads and asked if I could figure out where the human DNA came from.
The first question I asked was how much of the contaminating DNA is human. 63.5 million reads matched the human reference genome resulting in information on 701 Mb of the genome and only 0.1% of the genome covered with more than 15 reads. This level of sequencing is not enough to clearly answer an important follow up question: did one person contaminate the sample or many? An approximation can be made by using the mitochondria was sequenced to 1500x (off the charts below). Looking at the mitochondrial variants, that I’m not revealing for privacy reasons, showed that there was only one haplotype. This doesn’t really rule more than one person out but it supports a single contaminator.
Male or Female?
If my colleague contaminated the sample, then there should be Y chromosome DNA and half as much X chromosome DNA compared to the autosomes. The Y chromosome is very degenerated and full of repetitive DNA so we need to filter out all reads that also map to other chromosomes. Once those are thrown out, there are 7454 reads that mapped the the 59Mb Y chromosome. Visual inspection of these remaining reads shows that they often have insertions/deletions in the mapping and are suspect.
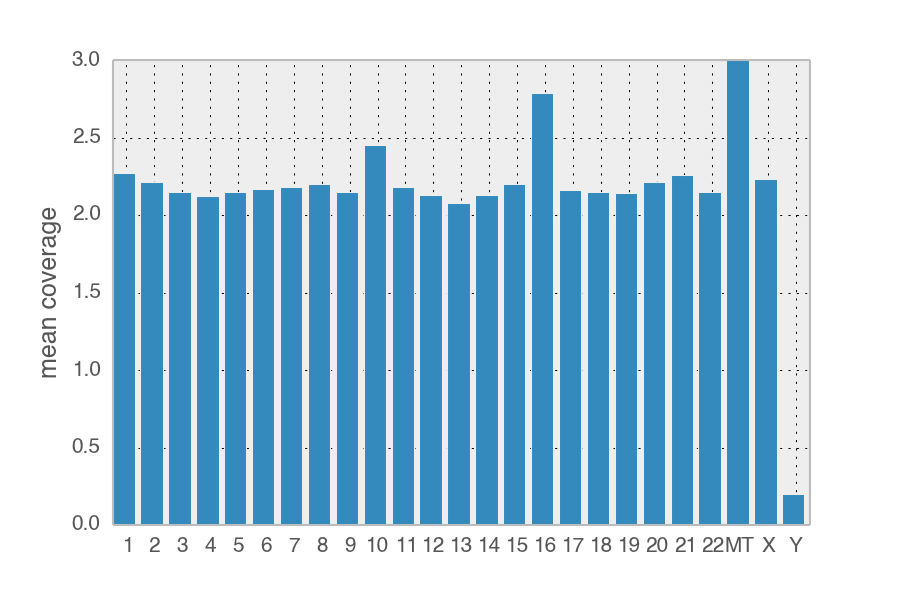
The relative coverage of the X chromosome is with same range of the autosomes, suggesting whoever contaminated the sample is XX and not XY.
Not my officemate but who?
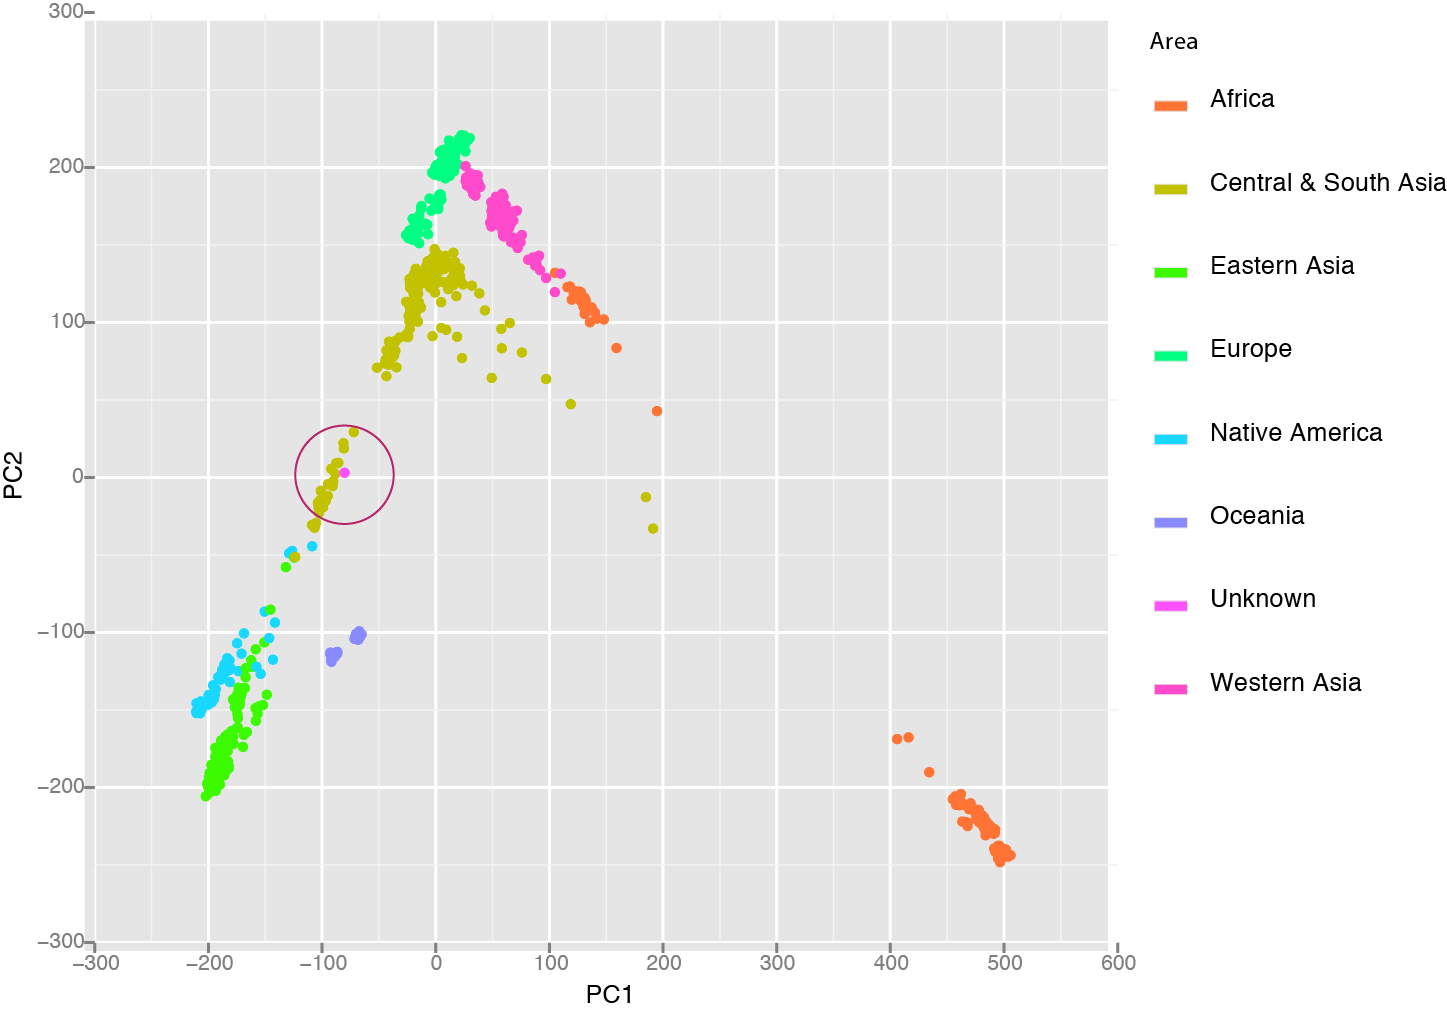
The next person to process the sample was our extremely proficient technician who is normally beyond suspicion but is female along with the rest of the people who process the sample at our sequencing core. They all fit the genetic profile so far which meant I needed to dig a bit deeper. To do this I used the Human Genetic Diversity Project, a collection of polymorphism collected from specific populations across the world. Each population was genotyped at 600,000 positions and I looked at the polymorphisms in the contaminate to see which population it matched the best. After I did this by hand, a great tool called LASER has been released to make this a one step analysis. Plotting the Unknown along with the HGDP samples shows that it clusters nicely in the Central/South Asian group, ruling out our tech and maintaining her spotless record.
I could show a whole lot more information about this person but won’t because I don’t know who it is and I don’t have consent. I guess I could try to do a facial reconstruction. I purposely did not look at any health related SNPs. I was even a bit worried that the ratio of X/Y/autosome could reveal something invasive like Klinefelter syndrome. At the end of the day, I really wouldn’t be able to say much about this person’s health risk but I can say quite about about her ancestry and so could anyone else who got their hands on a DNA sample.
Two by Two
What makes up the mass of a tree? Everyone learns about photosynthesis multiple times in school and yet when MIT and Harvard undergrads were questioned upon graduation “Where does the mass that makes up a tree come from?”, only a few knew the correct answer http://www.learner.org/resources/series26.html. Many said sunlight, soil, minerals, oxygen, and water, which are of course involved but most failed to make the connection that carbon dioxide in the air is transformed into 95% of the tree’s mass. People know that plants need sunlight and air and that they make their own food but don’t make the jump to put these pieces of information together and answer this fundamental question. Given this abysmal track record, it is not surprising that when most people are given facts about mutation rates and nuclear decay they fail to understand that these facts have a fundamental impact of the question, where do species come from? In particular, given a mutation rate and an amount of mutations in a population, how long ago did the population share a common ancestor?
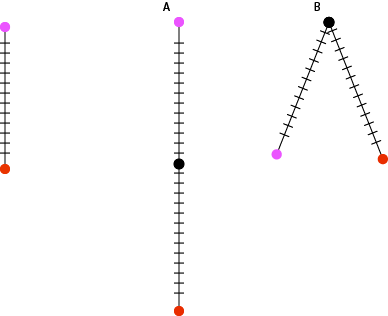
Let’s try a few observed differences: If the mutation rate for an organism with a 3 billion nucleotide genome is 2 mutations per 100 million bases per generation and there are zero differences between two individuals then they are clones. If there are 60 differences between the genomes of two individuals then they must only be one generation apart. If there are 120 differences, then they must be two generations apart. There are a few models that fit this observation: there could be two serial generations apart, grandparent and grandchild, or two parallel generations, they share a common parent.
Following some very basic assumptions we can measure how distantly related two individuals are just from counting the number of differences in their genomes. The more differences, the more generations between them. If we are sampling individuals from the same generation then we can rule out serial generations and know that we are measuring how long ago they shared a common ancestor. When the size of a population gets to be very very small, the amount of genetic diversity also becomes very small. There are just less individuals to carry diversity to begin with. We see this with crop species all the time and it becomes an important consideration when maintaining the genetic health of a population. Cultivated bananas are clones and from the 1920s -60s, the primary strain http://en.wikipedia.org/wiki/Gros_Michel was wiped out by a fungus. A population bottleneck will decrease the amount of diversity and leave a dramatic signature of the population that will persist for many many generations. This is one reason that the measurements that follow are of effective population size in terms of genetic diversity. The actual number of individuals is going to be larger, usually much larger.
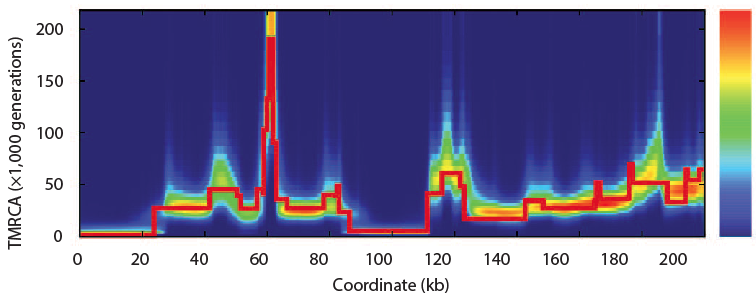
In 2011 Heng Li and Richard Durbin took a single human genome containing a chromosome from each parent and looked are all the places where there are differences between them. Parts that have fewer differences had a common ancestor more recently than those with more differences. By scanning across the genome and by noting that because of recombination, different parts of a genome have a different history, they found that the model of the past that best fit the observed data. Of course, they tested the model with simulations and found that the method of a pairwise sequentially Markovian coalescent (PSMC) recovered the true simulated history.
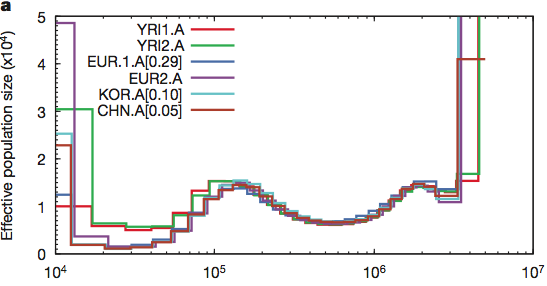
Now looking at several sequenced humans and using this same method they confirmed the out of Africa bottleneck of European and Asian populations. In this plot, the present is on the left and goes into the past on the right. At no point does the human population go down to Noah, Wife, three daughter-in-laws (10 chromosomes).
Maybe humans are weird and somehow misbehave in this model. Let’s look at the crawling creatures and the birds of the air. Many animals have been sequenced and if the population was reduced to two pairs (4 chromosomes) then maybe they will show this signature. The pig is the classic unclean animal and there should only have been two on board.
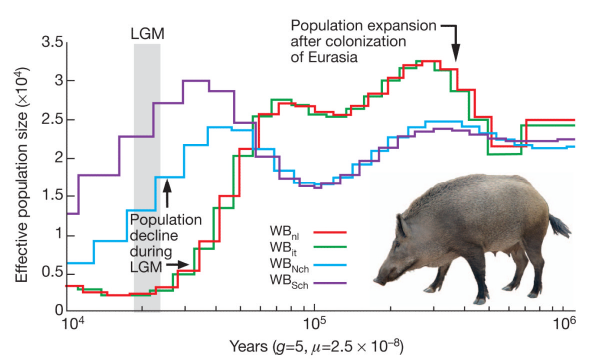
The lowest the effective pig population ever sank is around 250 individuals. How about birds? Here is the history of the falcons:
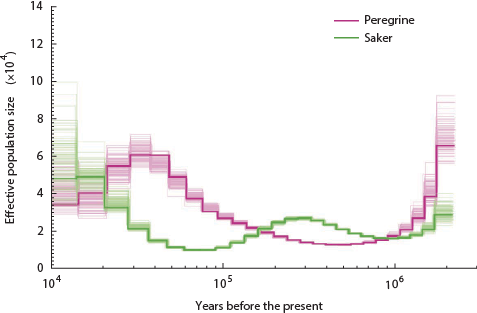
Nope, only went down to 1,500 ish.
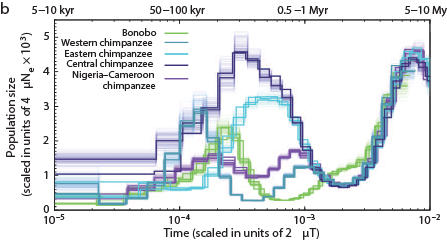
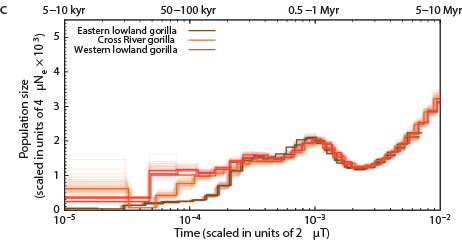
The Chimps, Bonobos, Gorillas, and Orangutans that should have been on the Ark:
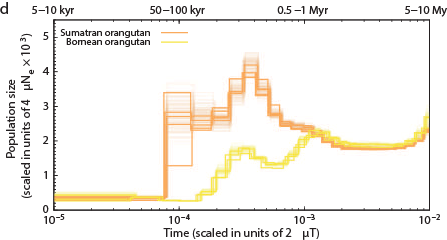
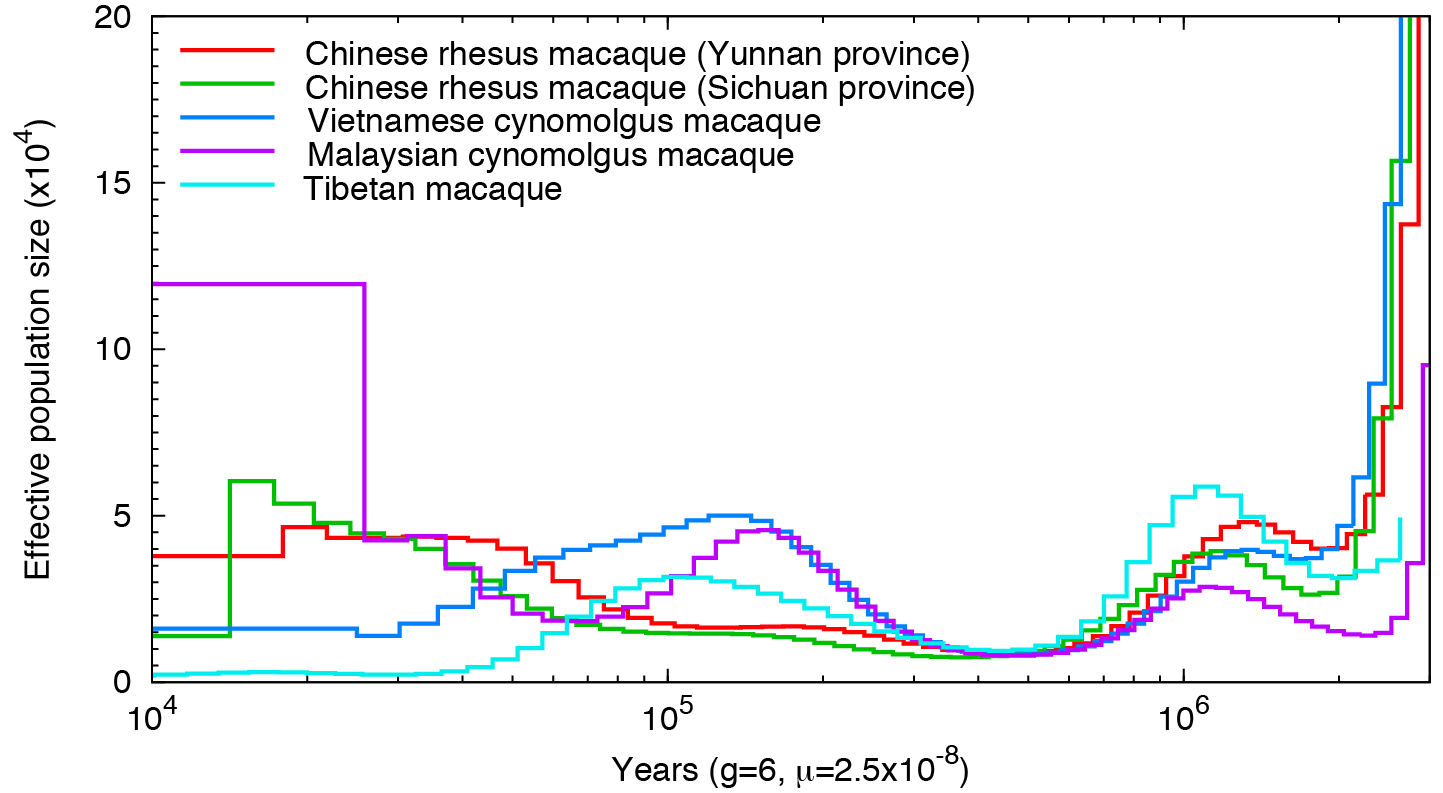
Other primates:
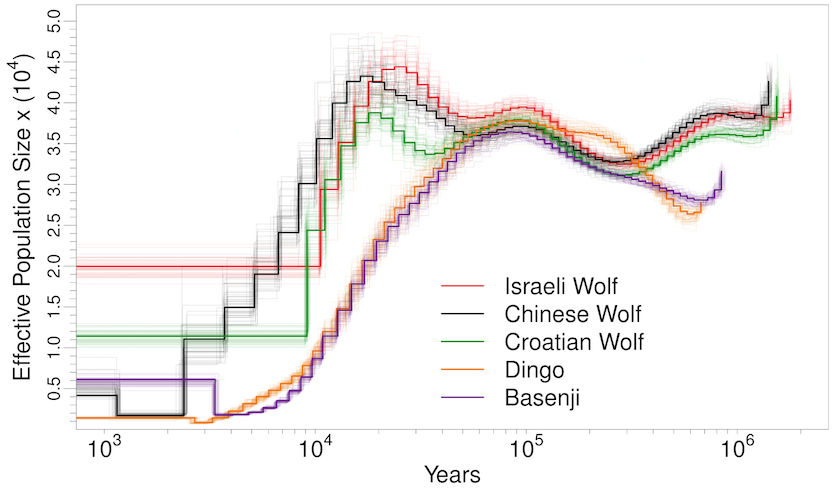
Man’s best friend et al:
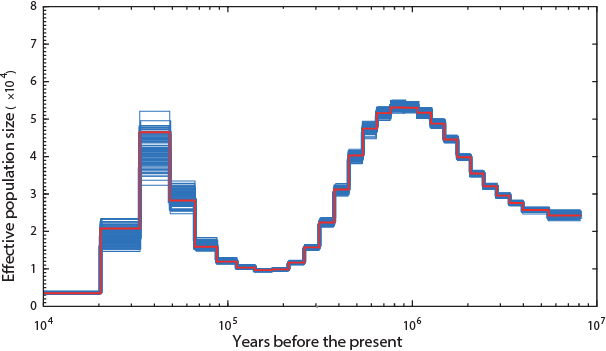
The Panda (hope Noah had enough of the single species of bamboo they ate):
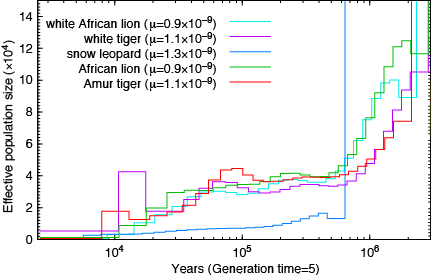
Lions and Tigers:
How about the reptiles:
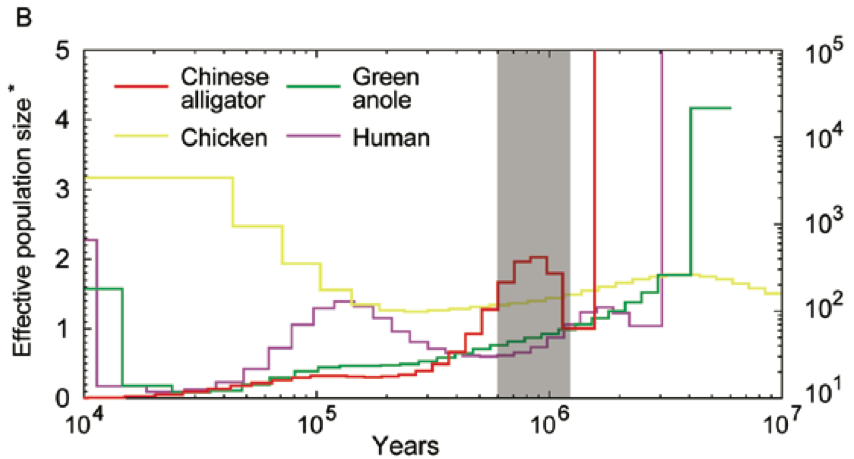
Not a single species underwent a severe bottleneck 5-10 thousand years ago. Even if the dates were wrong, all these species did not experience a bottleneck at the same time. If the tale of Noah’s Ark were true, it should be etched in the genomes of the animals on the boat and it isn’t.
Sources:
Humans: http://www.ncbi.nlm.nih.gov/pmc/articles/PMC3154645/ Great Apes: http://www.nature.com/nature/journal/vaop/ncurrent/full/nature12228.html?WT.ec_id=NATURE-20130704 Tibetan Macaque http://mbe.oxfordjournals.org/content/early/2014/03/18/molbev.msu104.full.pdf+html Malaysian Macaque: http://www.ncbi.nlm.nih.gov/pmc/articles/PMC3491380/ Pandas: http://www.nature.com/ng/journal/v45/n1/full/ng.2494.html?WT.ec_id=NG-201301 Pigs: http://www.ncbi.nlm.nih.gov/pubmed/23151582 Lions and Snow Leopards: http://www.ncbi.nlm.nih.gov/pmc/articles/PMC3778509/#!po=89.2857 canids: http://www.plosgenetics.org/article/info%3Adoi%2F10.1371%2Fjournal.pgen.1004016 Chickens, Alligators, Anolis: http://www.ncbi.nlm.nih.gov/pmc/articles/PMC3760627/#!po=34.0909 Falcons: http://www.nature.com/ng/journal/v45/n5/full/ng.2588.html