Two by Two
What makes up the mass of a tree? Everyone learns about photosynthesis multiple times in school and yet when MIT and Harvard undergrads were questioned upon graduation “Where does the mass that makes up a tree come from?”, only a few knew the correct answer http://www.learner.org/resources/series26.html. Many said sunlight, soil, minerals, oxygen, and water, which are of course involved but most failed to make the connection that carbon dioxide in the air is transformed into 95% of the tree’s mass. People know that plants need sunlight and air and that they make their own food but don’t make the jump to put these pieces of information together and answer this fundamental question. Given this abysmal track record, it is not surprising that when most people are given facts about mutation rates and nuclear decay they fail to understand that these facts have a fundamental impact of the question, where do species come from? In particular, given a mutation rate and an amount of mutations in a population, how long ago did the population share a common ancestor?
Let’s try a few observed differences: If the mutation rate for an organism with a 3 billion nucleotide genome is 2 mutations per 100 million bases per generation and there are zero differences between two individuals then they are clones. If there are 60 differences between the genomes of two individuals then they must only be one generation apart. If there are 120 differences, then they must be two generations apart. There are a few models that fit this observation: there could be two serial generations apart, grandparent and grandchild, or two parallel generations, they share a common parent.
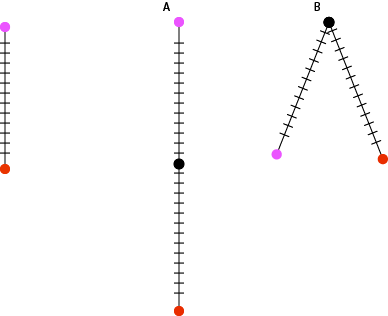
Following some very basic assumptions we can measure how distantly related two individuals are just from counting the number of differences in their genomes. The more differences, the more generations between them. If we are sampling individuals from the same generation then we can rule out serial generations and know that we are measuring how long ago they shared a common ancestor. When the size of a population gets to be very very small, the amount of genetic diversity also becomes very small. There are just less individuals to carry diversity to begin with. We see this with crop species all the time and it becomes an important consideration when maintaining the genetic health of a population. Cultivated bananas are clones and from the 1920s -60s, the primary strain http://en.wikipedia.org/wiki/Gros_Michel was wiped out by a fungus. A population bottleneck will decrease the amount of diversity and leave a dramatic signature of the population that will persist for many many generations. This is one reason that the measurements that follow are of effective population size in terms of genetic diversity. The actual number of individuals is going to be larger, usually much larger.
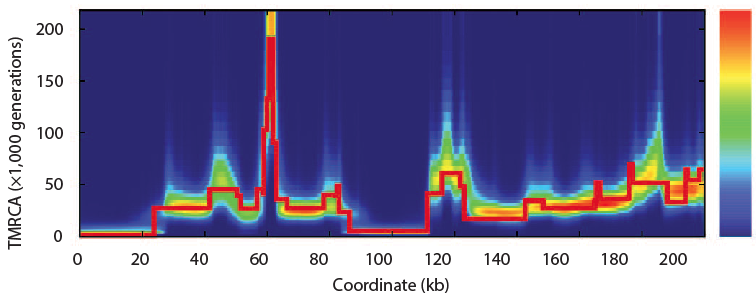
In 2011 Heng Li and Richard Durbin took a single human genome containing a chromosome from each parent and looked are all the places where there are differences between them. Parts that have fewer differences had a common ancestor more recently than those with more differences. By scanning across the genome and by noting that because of recombination, different parts of a genome have a different history, they found that the model of the past that best fit the observed data. Of course, they tested the model with simulations and found that the method of a pairwise sequentially Markovian coalescent (PSMC) recovered the true simulated history.
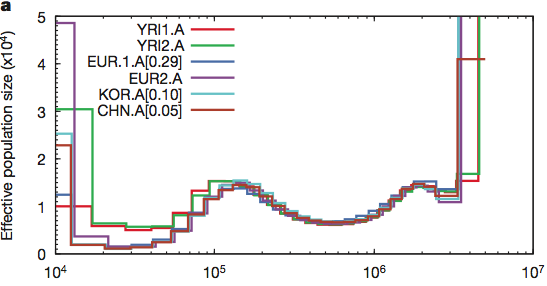
Now looking at several sequenced humans and using this same method they confirmed the out of Africa bottleneck of European and Asian populations. In this plot, the present is on the left and goes into the past on the right. At no point does the human population go down to Noah, Wife, three daughter-in-laws (10 chromosomes).
Maybe humans are weird and somehow misbehave in this model. Let’s look at the crawling creatures and the birds of the air. Many animals have been sequenced and if the population was reduced to two pairs (4 chromosomes) then maybe they will show this signature. The pig is the classic unclean animal and there should only have been two on board.
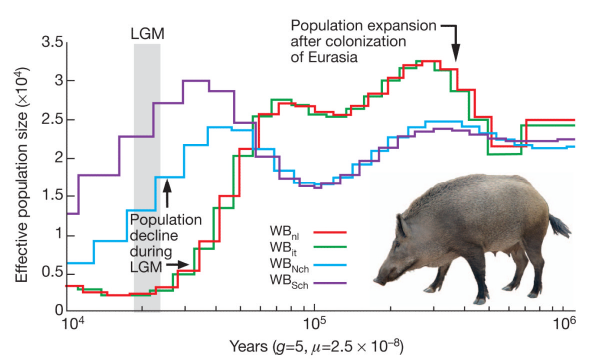
The lowest the effective pig population ever sank is around 250 individuals. How about birds? Here is the history of the falcons:
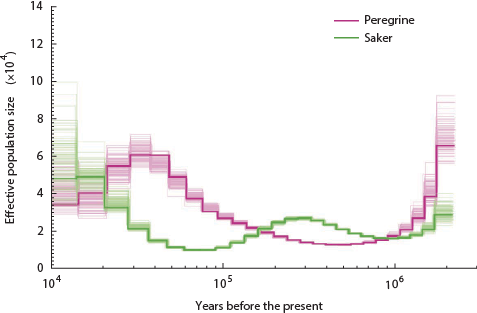
Nope, only went down to 1,500 ish.
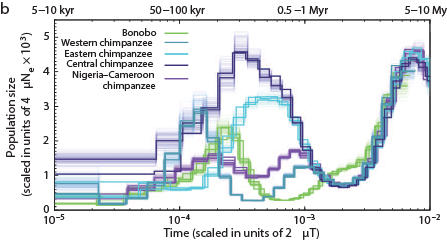
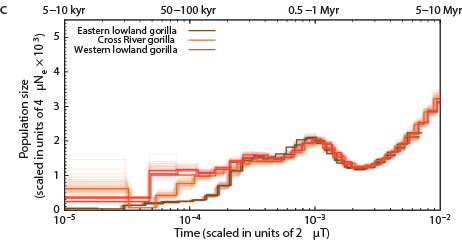
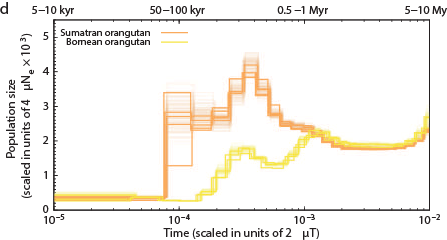
The Chimps, Bonobos, Gorillas, and Orangutans that should have been on the Ark:
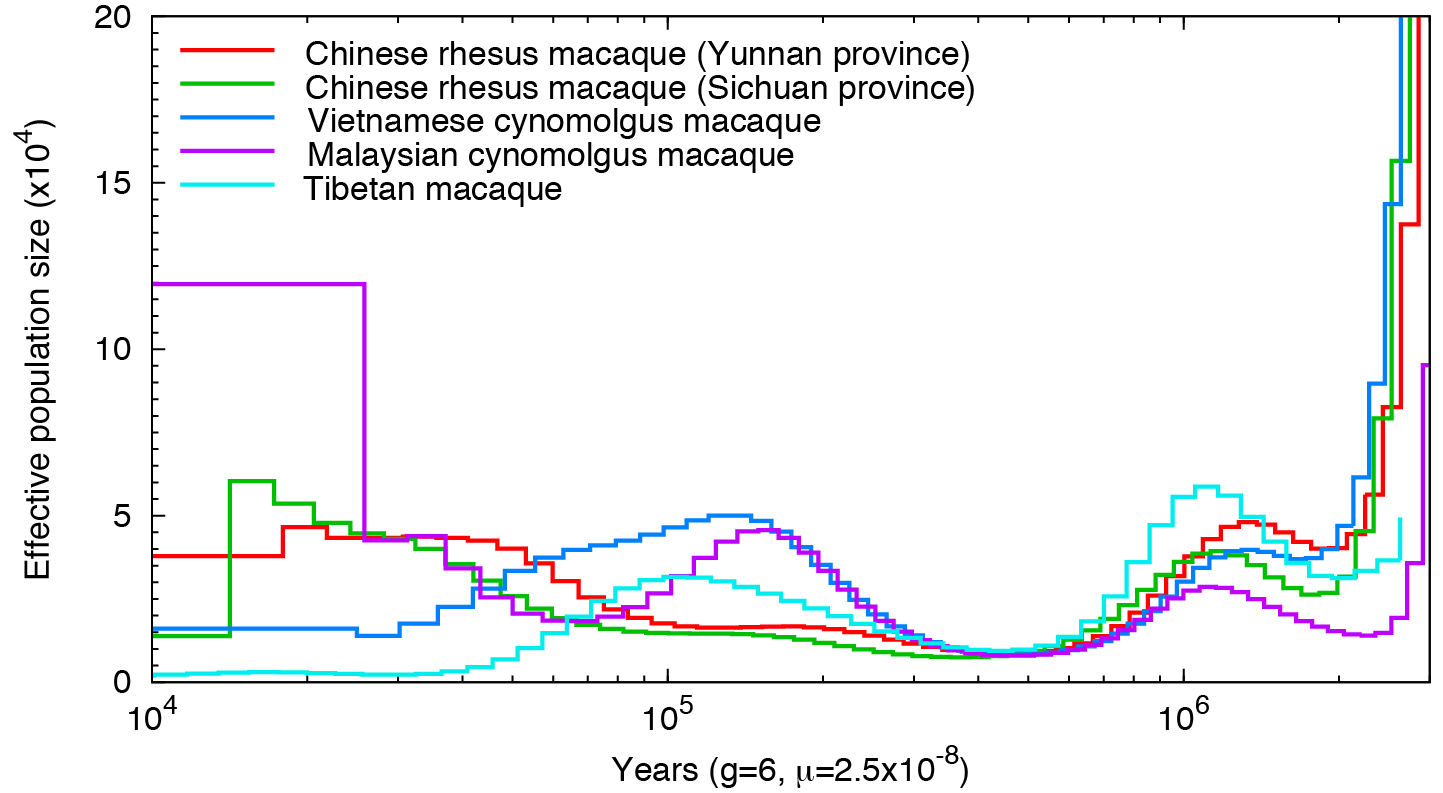
Other primates:
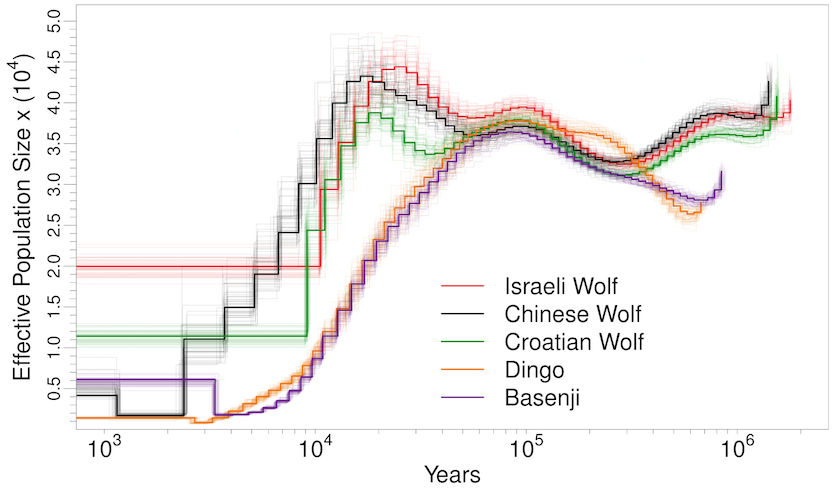
Man’s best friend et al:
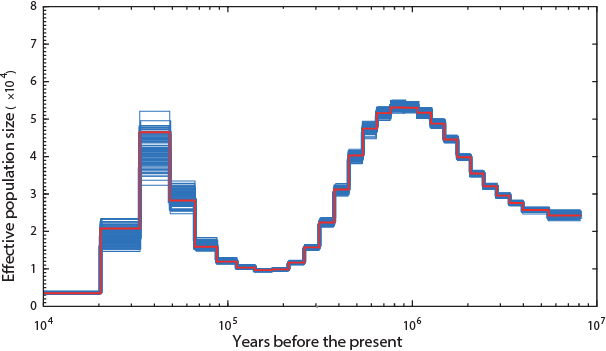
The Panda (hope Noah had enough of the single species of bamboo they ate):
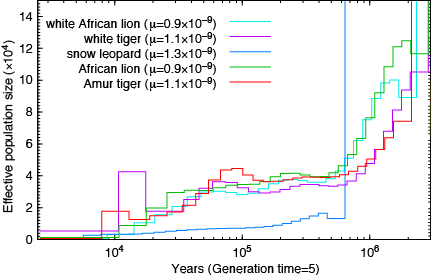
Lions and Tigers:
How about the reptiles:
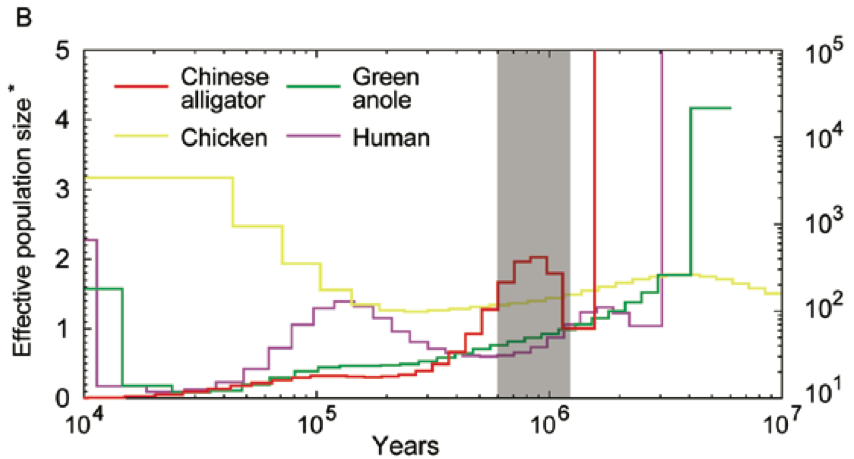
Not a single species underwent a severe bottleneck 5-10 thousand years ago. Even if the dates were wrong, all these species did not experience a bottleneck at the same time. If the tale of Noah’s Ark were true, it should be etched in the genomes of the animals on the boat and it isn’t.
Sources:
Humans: http://www.ncbi.nlm.nih.gov/pmc/articles/PMC3154645/ Great Apes: http://www.nature.com/nature/journal/vaop/ncurrent/full/nature12228.html?WT.ec_id=NATURE-20130704 Tibetan Macaque http://mbe.oxfordjournals.org/content/early/2014/03/18/molbev.msu104.full.pdf+html Malaysian Macaque: http://www.ncbi.nlm.nih.gov/pmc/articles/PMC3491380/ Pandas: http://www.nature.com/ng/journal/v45/n1/full/ng.2494.html?WT.ec_id=NG-201301 Pigs: http://www.ncbi.nlm.nih.gov/pubmed/23151582 Lions and Snow Leopards: http://www.ncbi.nlm.nih.gov/pmc/articles/PMC3778509/#!po=89.2857 canids: http://www.plosgenetics.org/article/info%3Adoi%2F10.1371%2Fjournal.pgen.1004016 Chickens, Alligators, Anolis: http://www.ncbi.nlm.nih.gov/pmc/articles/PMC3760627/#!po=34.0909 Falcons: http://www.nature.com/ng/journal/v45/n5/full/ng.2588.html