subscribe via RSS
Making an organism out of a genome with python
Genomes are long strands of nucleic acids consisting of the instruction guide for the assembly of an organism. Once sequencing projects are completed we conceptualize genome as strings of text for convenience instead of huge chemical diagrams. There are really powerful techniques that researchers can use to manipulate and study these long strings of ‘ATGC’ but sometimes I feel like these abstractions lose a bit of the linkage of the genome to the organism that it came from. If I was given a file named GRCh37.p13.fasta and nothing else, it would take a bit of work just to figure out that this is from a human.
How can we identify an organism just by looking at the sequence? I don’t know of a method but one you know what it is, how can you use it to represent the organism? One cool way from Peter Cock at blastedbio is to turn a bit of the genome into a pixelated picture of the organism. The conceptual steps are to take the colors from a region of a picture and write a letter from the genome in that color. He used it for making pictures of the potato genome but anyone can take their favorite genome sequenced organism and do the same thing! Peter wrote this so that the output is a series of pdfs of various sizes for your poster making needs. For convenience, I’ve made his script a bit more general and posted it here: https://github.com/aihardin/picobio/blob/master/acgt_dither/dither_rgb.py To use this, first make sure you have BioPython, numpy, Python Image Library and reportlab installed. Then get a picture from wikipedia and a genome from flybase and run it like so: python dither_rbg.py dmel_wiki.jpg dm3.fasta
.jpg)
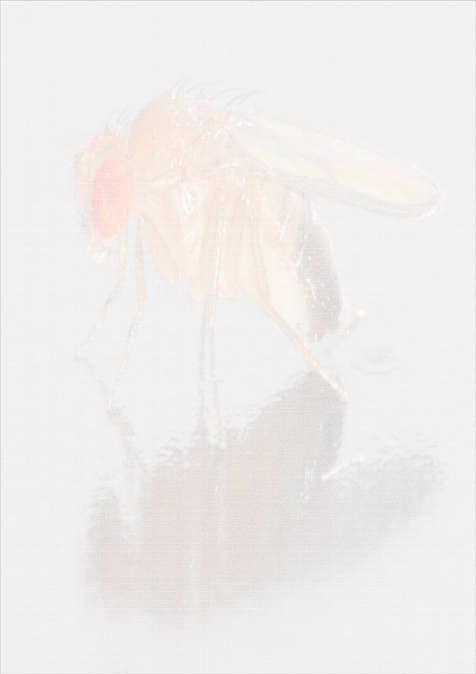
I’ve resized this image so it is a reasonable size for my hosting limits. A side effect is that the individual characters are no longer visible and it looks more like the original image. While this is a cool compression artifact, it loses the intent of the program. Here is a sample of the full size image: 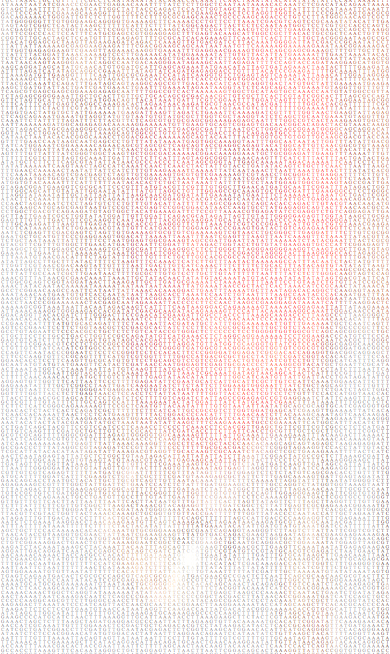
While one fly is awesome, I enjoy the evolutionary perspective and using these fantastic illustrations by Mrs. Sarah L. Martin provided by FlyBase and this list of sequenced Drosophilids curated by Casey Bergman, I created pictures of all available fly genomes below. Warning, these are rather large PDFs so don’t open in your browser.
The melanogaster iceberg
One thing that I like about studying fruit flies is that as a species, they share a similar history with humans. Both D. melanogaster and H. sapiens diverged from their common ancestors while in Africa and have since undergone a population explosion and spread across the world within tens of thousands of years ago. I don’t know how many other species share this pattern but I would guess that anything that lives off of human byproducts is similar: mice, rats, lice.
In the past, fruit flies have taught us many things about genetic mechanisms starting with the first link of chromosomes to genetics in the pioneering work of Thomas Hunt Morgan in the early 1900s. Once DNA was understood and scientists were able to read the bases, fruit flies were the first organisms to have a gene sequenced at a global scale (eleven samples but a huge amount of work at the time). This trend of a model organism informing us on the natural processes that we expect to be occurring in humans has been immensely useful. Viruses, bacteria, yeast, fruit flies and a plant all had their genomes sequenced before a human sequence was finished. However, once DNA sequencing and other technologies became cheap enough, scientists spent a huge amount of time and money to characterize the amount of human genetic diversity. First by interrogating diversity at specific nucleotides with microarrays with the HapMap Project and then supplementing with whole genome sequencing in the 1000 Genomes Project we quickly amassed more data on humans than any other species. Now the trend has flipped and we can apply information we have gathered on H. sapiens to D. melanogaster.
One example of a modern human study that supasses anything done in flies is the joint work of the Novembre lab, then at UCLA now at U of Chicago, and the pharmaceutical company GlaxoSmithKline in sequencing 202 genes from 14,002 people. I’m not sure what the maximum gene sequencing depth we have on D. melanogaster but it is nothing close to 14,000. Maybe a thousand? In any case, the reason that this data set is interesting is that we do not know how much genetic diversity is in the human or fly population. We do know that both populations are growing at enormous speed historically speaking and based on that fact we can predict there will be a large amount of new and rare variants in the population. This follows from realizing that each new individual inherits variants from their parents and also through various mechanisms, creates new mutations in their genomes. In an expanding population, most people will not have had time for their new alleles to spread and will therefore be rare. These rare alleles are potentially very relevant to human health since purifying selection has not had time to purge them from the population. The idea that these new deleterious mutations increases the average genetic burden has been challenged recently by Jonathan Pritchard and Guy Sella’s labs but the total number of deleterious alleles in the population still goes up.
Using exon capture methods followed by high throughput sequencing, the Novembre lab were able to find alleles that were present at frequencies as low as 0.007%. I attended a presentation Novembre gave about this work and he described Fig 1B as an “iceberg plot” meaning that the previous studies only saw the tip of human genetic variation.
 The human genetic variation iceberg. Variants that could be found in samples with up to 200 individuals shown on top and everything else below.
The rest of their analysis goes on the show that the rarest of variants are more likely to be damaging and that the iceberg goes down even farther than this, particularly in the African populations.
I’m quite curious if this same pattern exists in the global D. melanogaster population. I don’t have 14 thousand flies to sequence but I do have the genomes from the Drosophila Genetic Reference Panel, the Drosophila Population Genomics Project and some prerelease genomes from Casey Bergman and Penny Haddrill for some 325 fully sequenced genomes. Baring line mixups and all kinds of mistakes I could have made, #overlyhonestmethods, I should be able to see some excess of rare variants since the DPGP genomes are mainly African and have higher diversity. I’m not going to make as fancy of a figure as Novembre did since this is also an exercise in learning D3.
Method: align all raw sequence data to the reference genome with BWA/Stampy. Realign mapped reads and call variants with GATK. Recalibrate the variant quality with snps called from four DGRP genomes resequenced to 50x coverage on a HighSeq by me (well, really resequenced by the lab’s awesome and talented tech who wishes to remain behind the scenes for now). Filter out false positives and non-biallelic snps. The second filter is going to decrease the number of rare alleles found but this is quick and dirty and it makes the partitioning easy. Then use GATK and bedtools to find how many segregating sites are in each exon:
java -jar ~/bin/GenomeAnalysisTK-2-latest/GenomeAnalysisTK.jar -R ~/data/genome/dm3.fasta -T SelectVariants --variant global_snps.recalibrated.sep.pass.vcf.gz --restrictAllelesTo BIALLELIC -select "AF >= 0.005" --logging_level ERROR|bedtools intersect -sorted -a ~/data/annotation/dmel_gene.gff -b stdin -c > all_highfreq_gene_counts.bed
A bit of python to turn the bedtools outputs into a proper GFF file:
low_fh = file('all_lowfreq_gene_counts.bed')
high_fh = file('all_highfreq_gene_counts.bed')
out_fh = file('all_gene_mut_counts.bed','w')
out_fh.write('##gff-version 3\n')
for line in high_fh:
    low_counts = low_fh.readline().strip().split('\t')[-1]
    exon_data = line.strip().split('\t')[:-1]
    high_counts = line.strip().split('\t')[-1]
    exon_data[-1] = exon_data[-1]+';high_count=%s;low_count=%s'%(high_counts,low_counts)
    out_fh.write('\t'.join(exon_data)+'\n')
out_fh.close()
And some more to process the GFF and get counts:
input_bed = file('all_gene_mut_counts.bed')
exons = {}
for line in input_bed:
    if line.startswith('##'): continue
    try:
        annotation = line.rstrip().split('\t')[-1].split(';')
        annotation = dict([tuple(a.split('=')) for a in annotation if '=' in a]) #skips the flag values but don't need them
    except ValueError:
        print line, annotation
#print annotation
exons[annotation['ID']] = (int(annotation['high_count']),int(annotation['low_count']))
mut_counts = zeros((3,len(exons)))

for i,exon in enumerate(exons):
    mut_counts[0][i] = exons[exon][0]
    mut_counts[1][i] = exons[exon][1]
mut_counts[2]=mut_counts[0]+mut_counts[1]
mut_counts.sort(axis=1)
out_fh = file('data.js','w')
out_fh.write('var high_freq = ['+','.join(map(str,mut_counts[0][-200:]))+']\n')
out_fh.write('var low_freq = ['+','.join(map(str,mut_counts[1][-200:]))+']\n')
out_fh.close()
Now I have the top 200 genes with the most segregating sites in them, sorted from least to most. To replicate the broad strokes of the iceberg plot, I wanted to use D3 and generate SVG files. I haven’t used javascript ever and it has been 8 years since I coded HTML so it took a bit but I managed to make some bar graphs:
We see with 325 genomes the hints of an iceberg! Variants seen at a frequency of less than 0.05% in this dataset means the singletons, the variants seen in only one of the genomes. I’m sure that with more genome sequences the D. melanogaster plot will look more like the H. sapiens. Other projects are in the works to describe genetic variation in other model organisms such as the plant Arabidopsis thaliana and the worm Caenorhabditis elegans.
In working through coding and presenting the D3, I leaned heavily on the D3 tutorial by Scott Murray and the tips of Charles Reid.
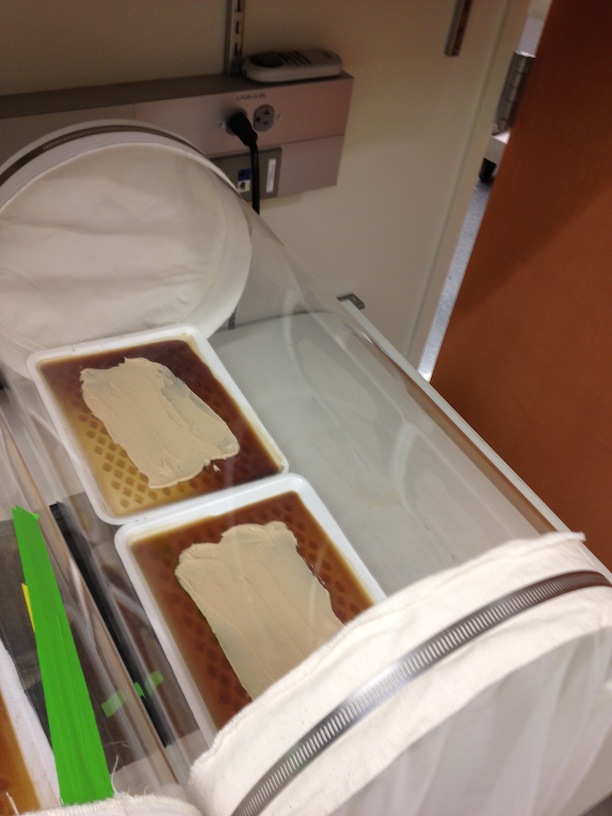
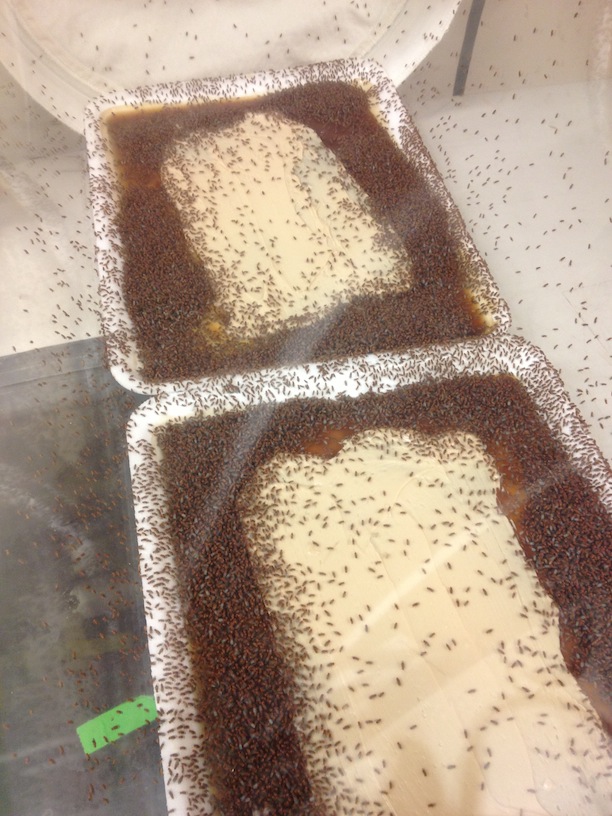
How to grow massive amounts of fruit flies
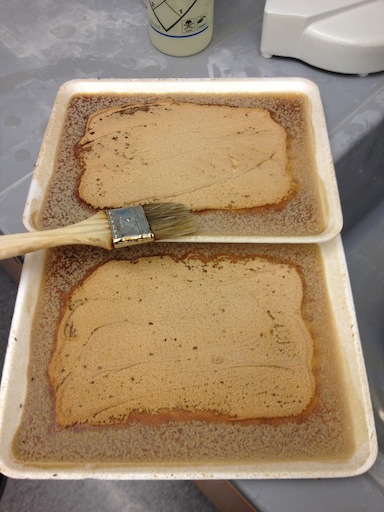
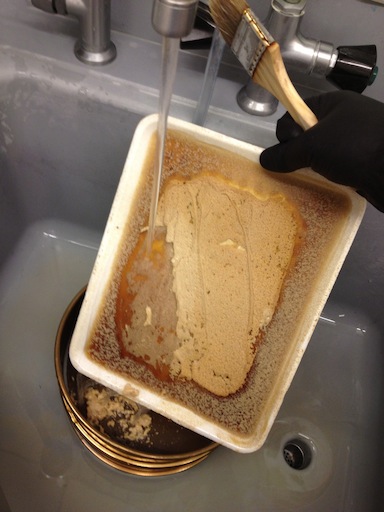
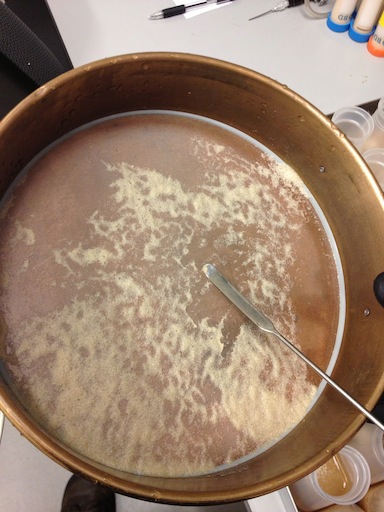
As we perpetuate the fruit fly circle of life, we need to start somewhere and I’m going to assume you already have some large amounts of egg laying flies in a population cage. These population cages are usually fed with yeast paste on some kind of sweet agar (molasses, apple juice, grape juice). Take the trays from the previous night’s feeding and gently wash the embryos into a double layer sieve so that the adult flies get stuck on the first layer and the embryos stay on the second. A boar hair paintbrush can be used to make sure all the embryos are recovered from the tray.
From here there are two ways to proceed: put the embryos in a box with yeast paste or put the embryos in bottles with banana paste and yeast. My fly strains didn’t do so well in the box so I’m going to show the bottle method.
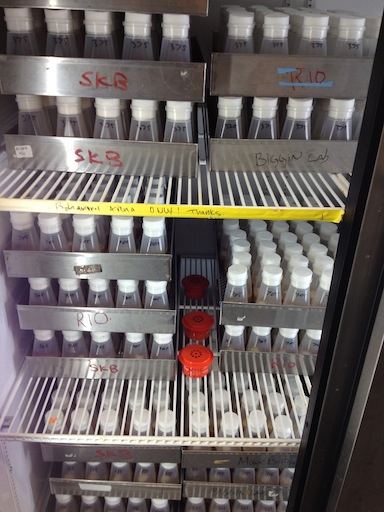
To get an optimum number of flies in the next generation, around 120-150ml, you will need between 3-5 large trays of bottles with 40 bottles per tray. In each bottle tap a small amount of yeast.
[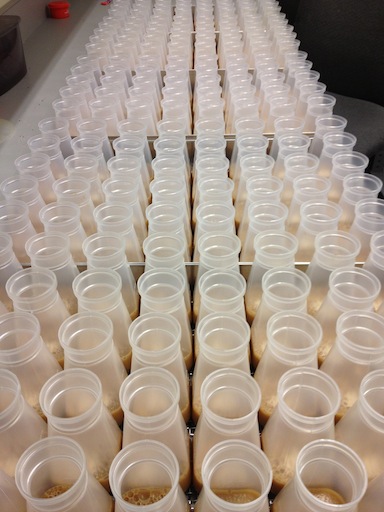 ]
]
Now using a nickel spatula, scrape up a pile of embryos no bigger than a grain of rice. Not those basmati rice grains, more like jasmine rice. Half of a fat sushi rice gain. I like to tap the yeast onto one side and the embryos onto the other so that the yeast doesn’t dehydrate the embryos. I don’t know if that would really happen but it also helps to find the embryo pile when it isn’t blending into the yeast.
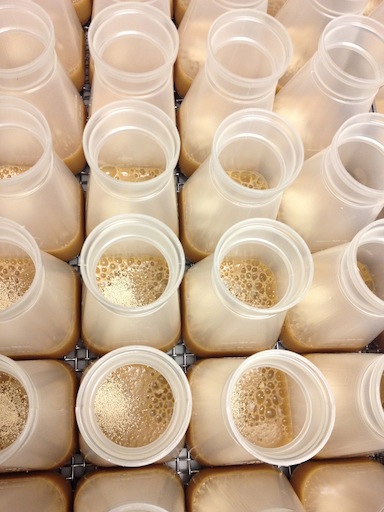 (
(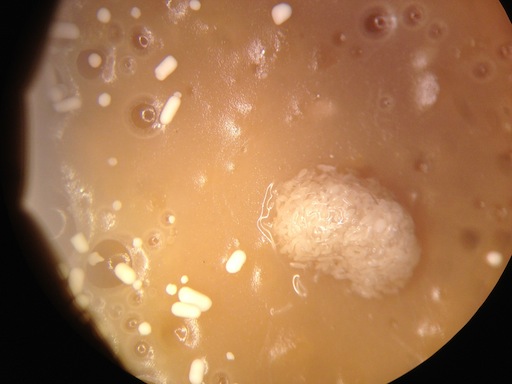
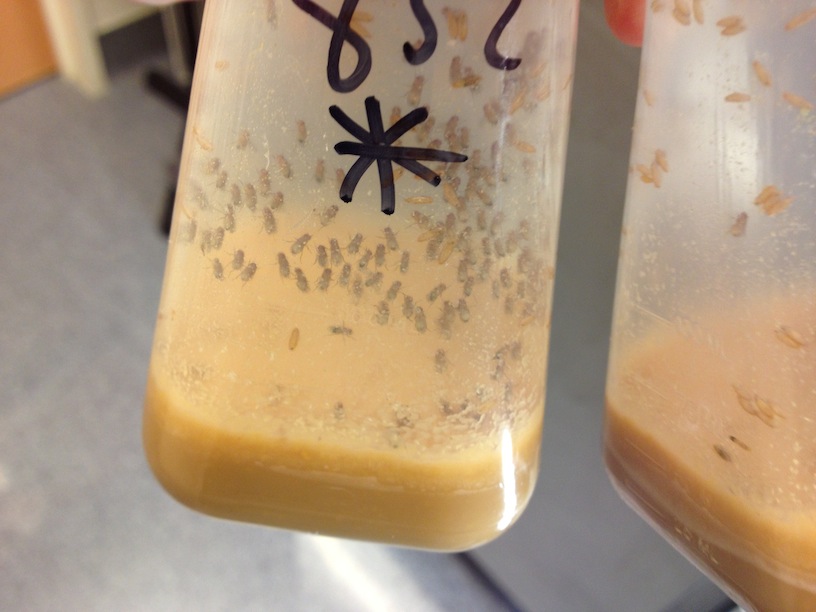
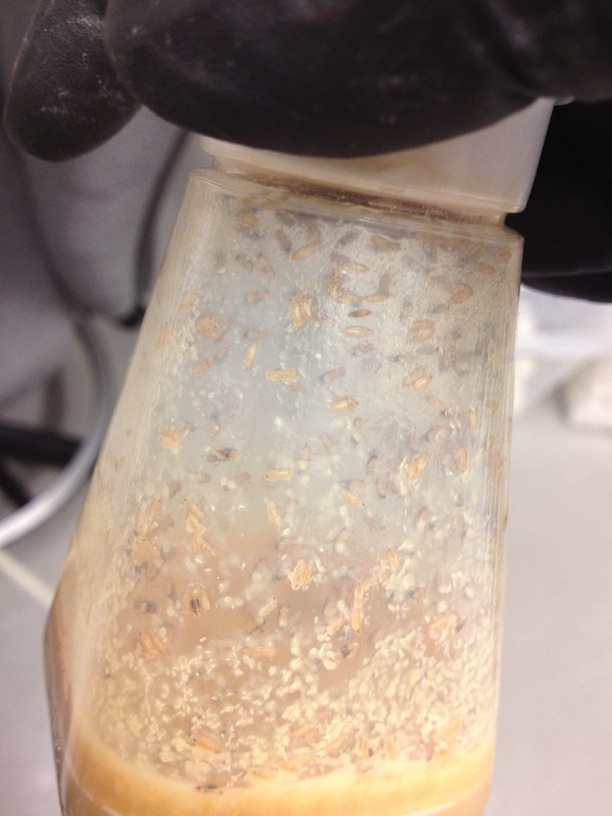
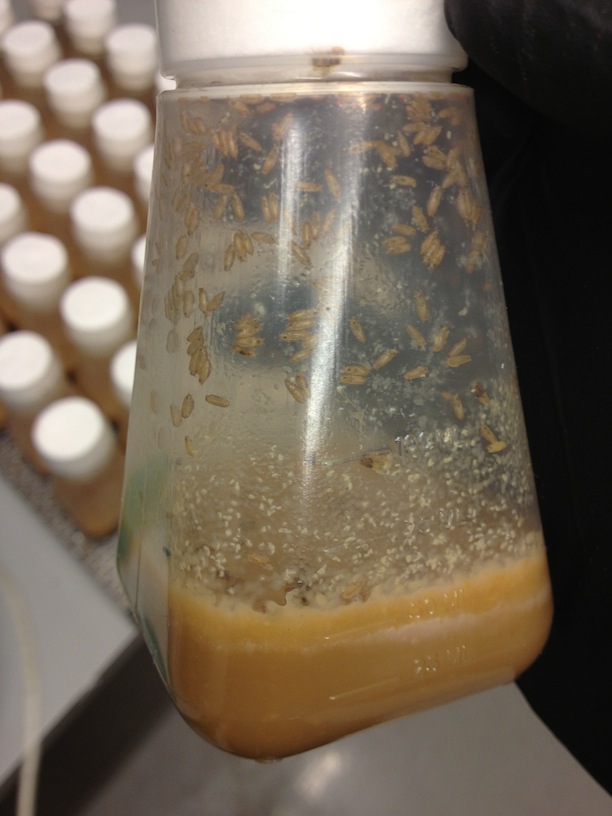
Once you have put the embryos into the full tray of bottles, plug them up, move to your incubator, and wait around 8-10 days.
It is hard to estimate the correct amount of embryos to put in each bottle. Too many and the larvae will be stressed, develop slower, and churn up the media so that it is goopy. Goopy bottles are really hard to tap the adults out of so don’t do that. On the other side, underpopulated bottles waste bottles since you need more of them. One tray of full but not too full bottles will yield around 50 ml of adult flies.
To collect the adult flies, I use a 200 ml flask and place it in an ice bucket with a bit of ice. I don’t pack the ice around the flack, it can be loose. The ice will keep the flies from trying to escape. Place a large funnel in the flask and tap each bottle into the flask. Be gentle with the flies in the flask and don’t shake them too much as you tap.
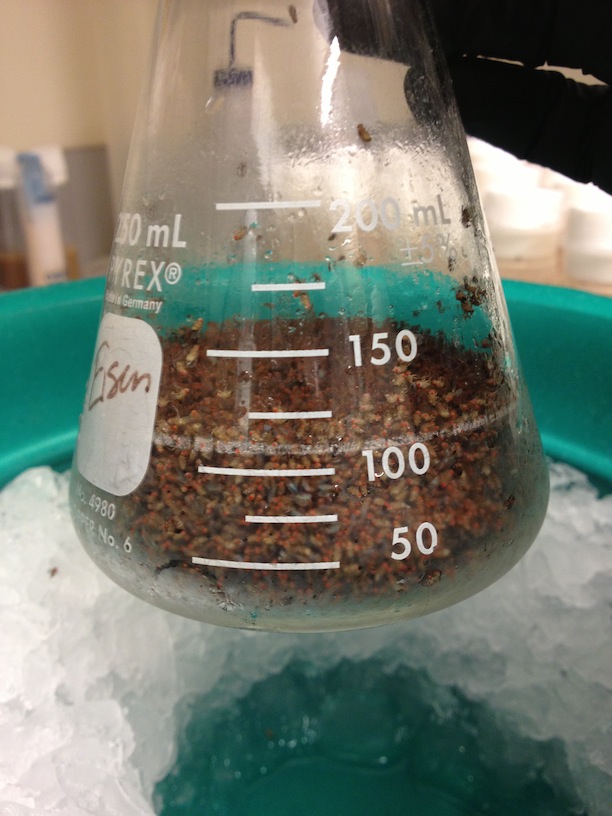
Once you have 120-150 ml of adult flies, dump them into your prepared population cage and get ready to do this again in a week!
Bottles and plugs can be purchased from FlyStuff, and the cages as well. I cut out the middleman for the population cages and bought acrylic tube from our local plastic supplier TapPlastics.